TLDR: Legal insights and reporting means turning matter, contract, and spend data into dashboards and reports legal teams can use to make decisions and prove impact. This guide covers what it means, why it matters, the metrics that count, a glossary of key terms, and answers to common questions.

LawVu's Insights & Reporting tool turns raw data that legal teams generate through their day-to-day workflows into something they can act on and communicate clearly to the rest of the business.
It does this by bringing together matter, contract, and spend data in a visual dashboard and real-time reporting. Legal teams oversight of what’s happening across the department without exporting anything into a separate Business Intelligence (BI) tool.
The benefits for legal teams:
This guide explains what legal insights and reporting is, how it can enhance your legal function, which metrics are worth tracking, and how to talk about it with confidence.
None of this replaces legal judgment. The departments that get the most value out of insights and reporting are the ones that treat it as a tool for better conversations, not a substitute for legal expertise.
They build it into their daily operations, whether that’s reviewing a dashboard in a weekly team meeting, checking spend against budget monthly, or pulling a cycle-time report before a process change.
This guide covers the fundamentals, the metrics that matter most, a glossary of common terms, and answers to the questions legal teams ask most often.
Insights are what you get when raw data is put into context. A number on its own, say "120 contracts," doesn't tell you much. But "120 contracts closed this quarter, up 15 percent from last quarter, with NDAs accounting for most of the increase" is an insight. It tells a story and points toward a decision.
Reporting is the mechanism that surfaces those insights. It's the dashboards, charts, and summaries that take legal data and present it in a way people can read and use, instead of leaving it buried in a spreadsheet or a case management system nobody outside legal ever opens.
In most legal departments, matter data, contract data, and spend data live in separate places, software platforms or even spreadsheets maintained by different people.
Every time someone needs to generate a comprehensive report on legal matters, they need to collect data from multiple places and stitch it together manually.
Legal operating systems such as LawVu approach this differently by treating matters, contracts, and spend as parts of one connected system of record rather than three disconnected data sets.
When data is collated in one central repository, it can generate real-time dashboards and configurable reports. This saves the legal team from wasting time on manual exports or wrangling separate analytics tools.
In a legal operating system, reporting is a byproduct of how the work is managed.
If a GC asks for a report that compares contract cycle time to outside counsel spend for a certain period, that information already exists and doesn't need to be pulled together from scratch.
Picture a mid-sized in-house team preparing for a quarterly business review. Under the old approach, someone spends the better part of a week pulling matter counts from one system, spend figures from an invoicing tool, and contract status updates from a shared drive full of spreadsheets, then reconciling all of it by hand before it even looks presentable.
Under a connected system of record, that same view already exists. The team spends its time interpreting the numbers and deciding what to do about them.
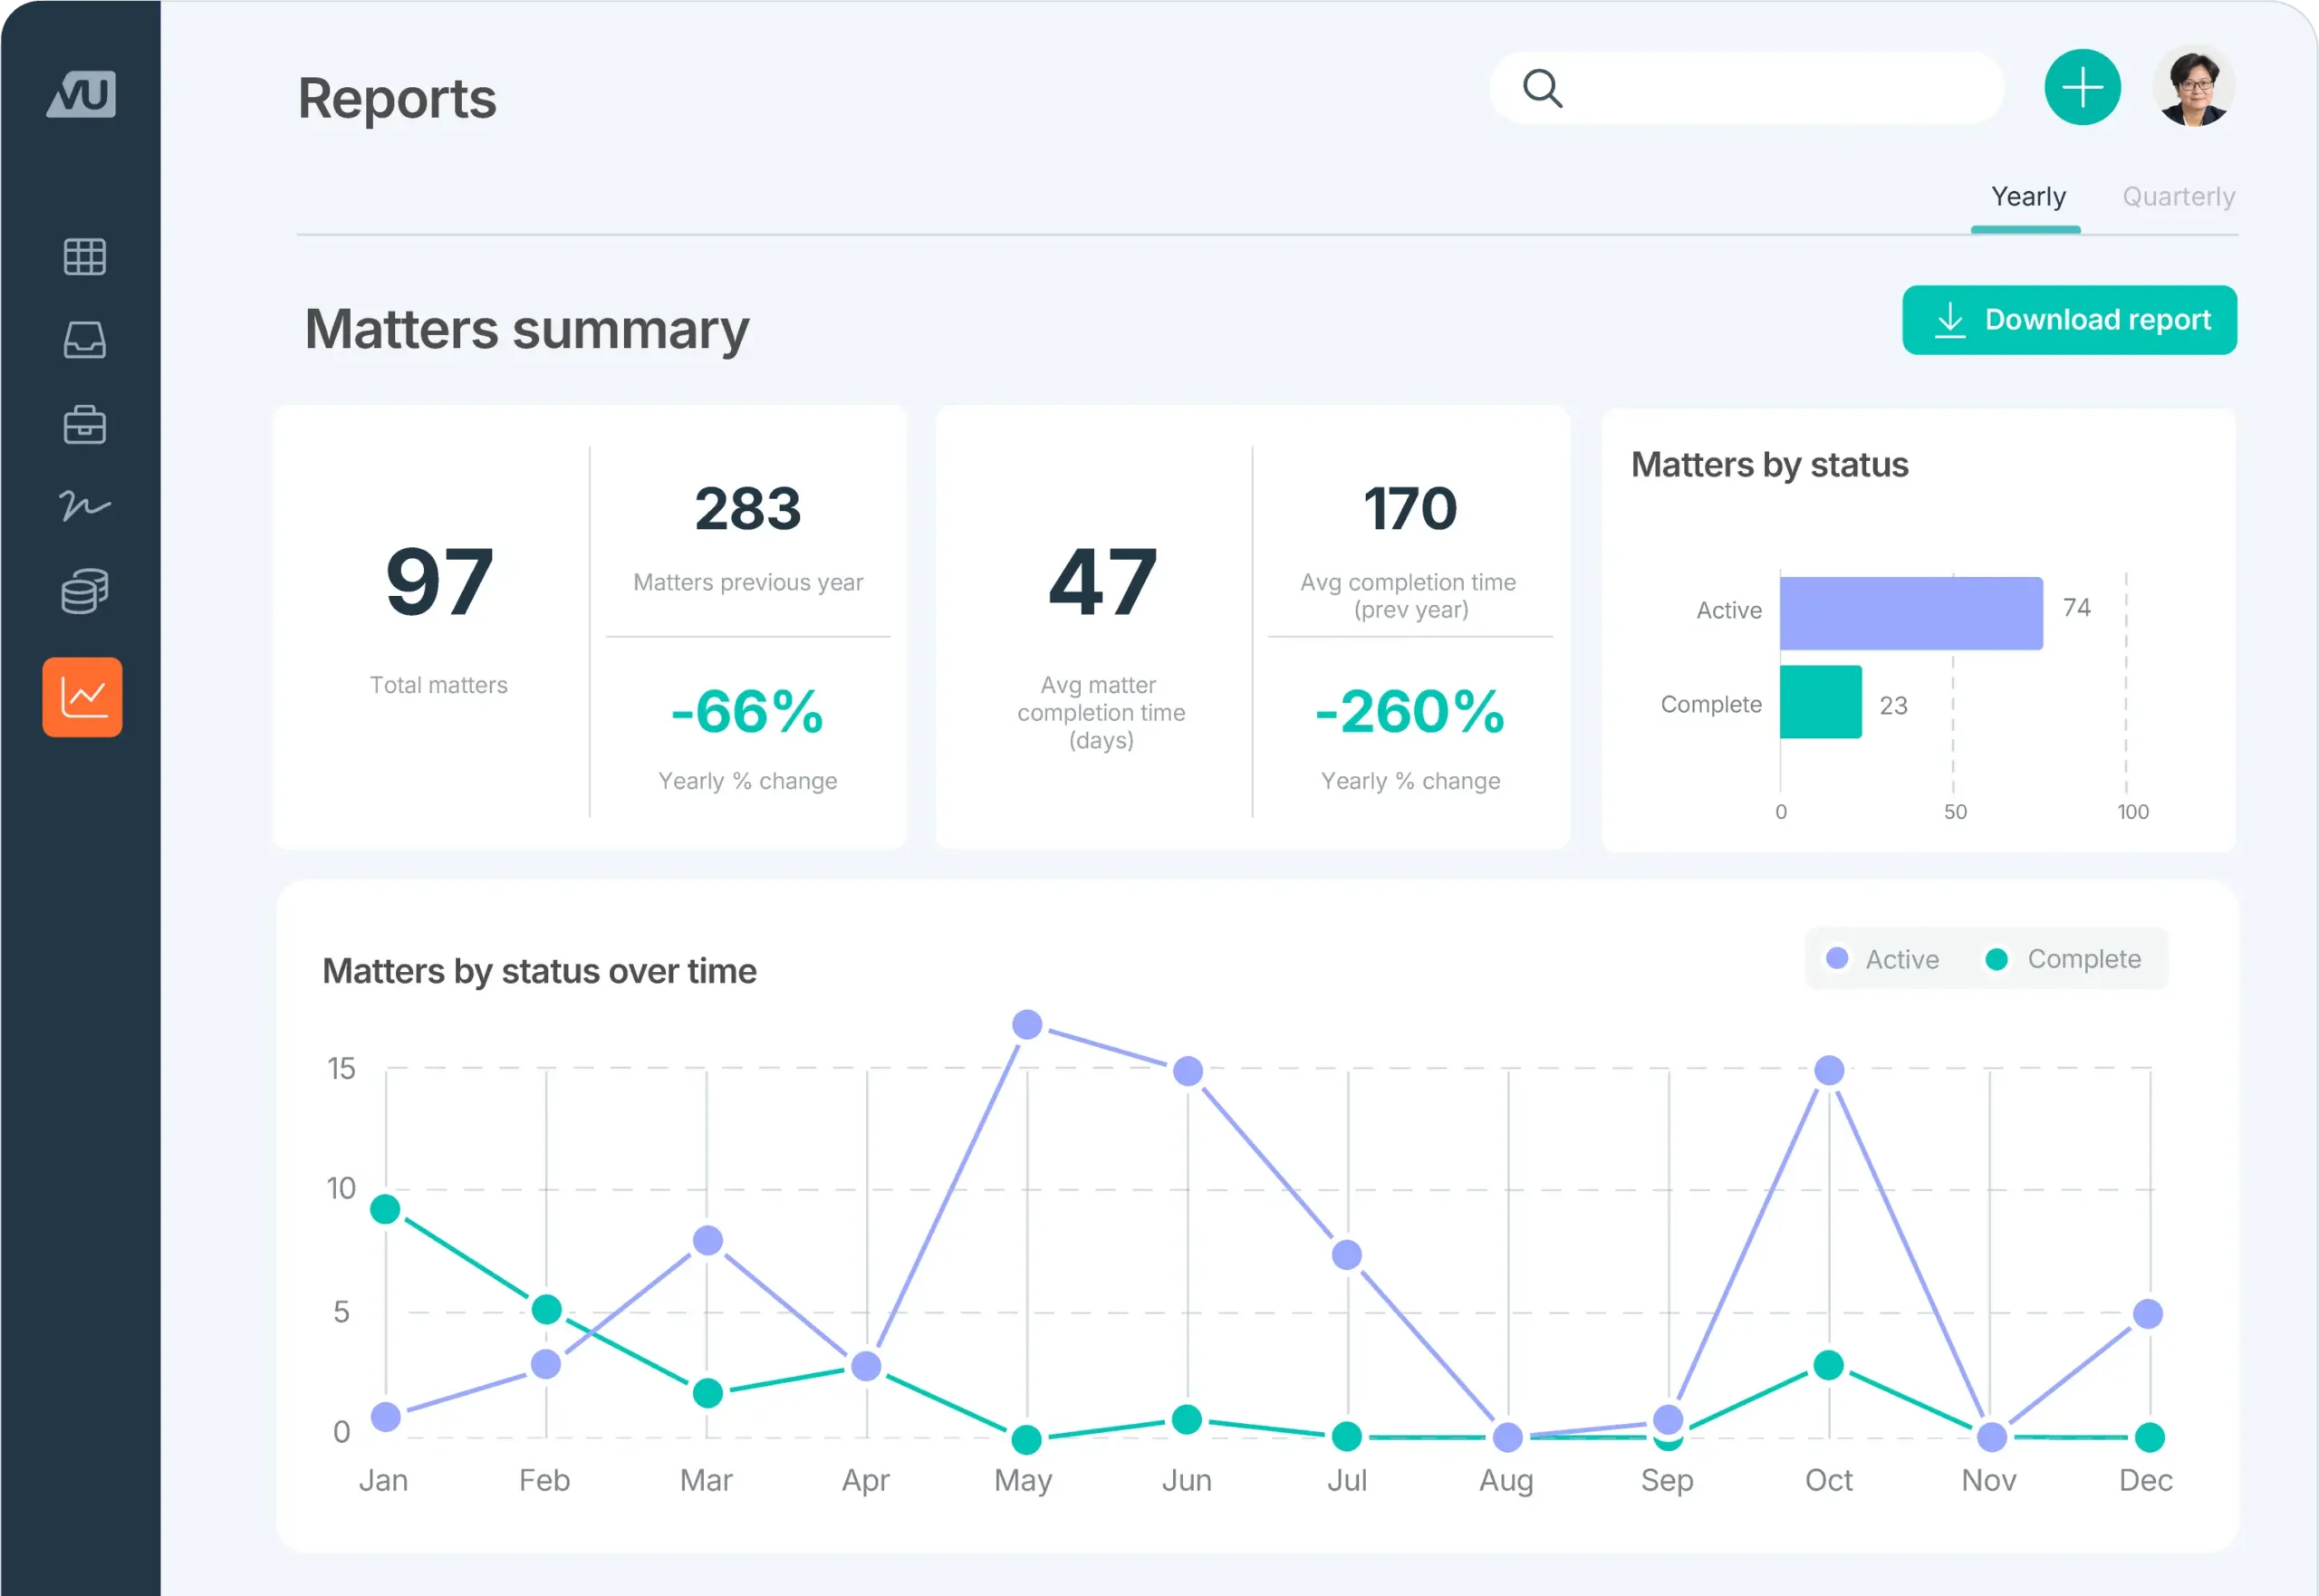
LawVu's Insights & Reporting dashboards give you workload, cycle time, risk, and spend data in one place no separate BI tool, no manual exports.
“Why is it that every other function (Sales, Marketing and Finance) has such great tech to drive efficiency and transform service delivery but the legal team might just get given email and a notebook – you can’t produce much at scale with that.”Seshani Bala, Partner and GC at KPMG New ZealandThis reactive way of working is not exactly persuasive in a budget meeting. Insights and reporting can change that by taking data that traditionally lives in a GC's head or in a scattered set of spreadsheets and structuring it so leaders can act on it. When every department is expected to justify its cost, that shift counts. Legal teams that can point to real numbers (cycle times trending down, risk exposure identified early, spend tracking against budget) are the ones that get treated as a strategic partner in the room, not just a function that reviews documents when asked. “We’re using data to move legal away from being that mystery black box,” says Bala.
When assessing these metrics in isolation, they only tell a partial story. For instance, data on matter volume without cycle time doesn't tell you whether the team is keeping up. Spend data without a sense of risk and value doesn't tell you whether that spend is well placed.
But when combined, they create a comprehensive picture, giving legal leaders something they've often lacked: a factual, current picture of where the department stands, made without needing to rely on intuition or memory.
Why each metric earns its place:
This page is a starting point. Depending on where you are, just getting familiar with the topic, ready to put metrics into practice, or actively evaluating software, here's where to go next.
Contextualized patterns and direction drawn from data that help guide a decision.
The structured presentation of legal data as dashboards, charts, and summaries.
A quantitative measurement that places raw data into context, for example hours worked or dollars spent.
A visual interface showing performance indicators and trends, typically in real time.
Key performance indicator. A strategic metric tied directly to a goal, such as efficiency, spend control, or risk reduction.
The time it takes to move from the start to the finish of a matter or contract.
The broader discipline of using data to spot trends, allocate resources more effectively, and forecast outcomes.
The single authoritative source where matter, contract, and spend data live, rather than being scattered across separate tools.
Business-user access to standardized legal tools or templates for routine requests, without needing to route everything through legal directly.
Legal reporting software such as LawVu provides out-of-the-box dashboards and interactive grid reports covering matters, contracts, and legal spend. You can drill into the numbers, filter by the fields that matter to you, export data, and customize views to match how your team works.
Spreadsheets are static and they tend to fragment: one person's version drifts from another's, and by the time a report is finished, the underlying numbers have often already changed. Centralized legal insights give you accurate, current analysis and free the team from the manual work of pulling, formatting, and reconciling data by hand.
Yes. Alongside the standard dashboards, more advanced users can build custom visuals or export the underlying data for deeper analysis elsewhere.
Insights give legal leaders trend analysis, early signals on risk, and a clearer sense of where to direct resources, which allows them to make more strategic decisions for the legal team.
LawVu integrates matters, contracts, and spend into one system of record, rather than treating them as a separate issue. That gives legal teams full context and consistent governance in one place, without a separate BI tool bolted on the side.
More often than once a year, which is how many teams currently treat it. A monthly review of spend and workload, paired with a quarterly look at cycle times and risk trends, catches problems while they're still small and keeps leadership's picture of legal current.
No. A dedicated legal operations role helps, especially at scale, but it isn't a prerequisite. Modern reporting tools are built to be read and used directly by general counsel and legal team members, with dashboards designed for people who don't have a data background.